Why weighting your survey data is often best
Playing the "weighting game" with your data
Understanding how a population thinks, responds, or behaves is a fundamental objective behind almost all research studies. In some cases, the population of interest is limited to the specific group of respondents, whether that's your current customer base or the members of a panel that fit particular criteria. At other times, the sample should represent a larger population.
Depending on objectives and feasibility, weighting data may be an appropriate way to measure a population of interest when your sample isn't representative of your desired population.
What is a weight?
A "weight" is simply a value we assign to a respondent that changes how much impact their individual answers have on the overall outcome.
The purpose of weighting data in market research
Simulate real-world populations
Weighting data allows us to simulate real-world populations. To make statements or draw conclusions about a group as a whole, we need to be sure those statements represent everyone in that group. Whether you're interested in research on the entire United States or just the people in your office — opinions differ. It's essential to uncover how those opinions or actions vary across distinct groups.
Control variables
In 2016, Bellomy helped a financial services company conduct research on where their customers went when they needed help or had questions about using its online platform. Then in April of 2020, the company wanted to see how changes made over the last four years impacted how their clients use the tools.
The 2016 study was a random sample of the clients, but when it came time to repeat the research in 2020, we weighted the data to match the sample from 2016. Why? To control for variation in audience composition. By weighting the data, we eliminated the influence that any differences between the 2016 and 2020 sample populations may have had on the results. We wanted to make sure we were comparing changes regarding the tools and not changes in population.
How to weight data
First, we need to know the breakdown of the population we're trying to simulate. That means having data on the desired population's metrics, which could be any number of things; common metrics include age, income, and region. There are often metrics specifically applicable to the research project outside of typical demographics.
Typically within a sample or dataset, some respondents represent a disproportionately higher segment of the population than others. To mitigate the difference between the actual population and the sample, we'd create a weight.
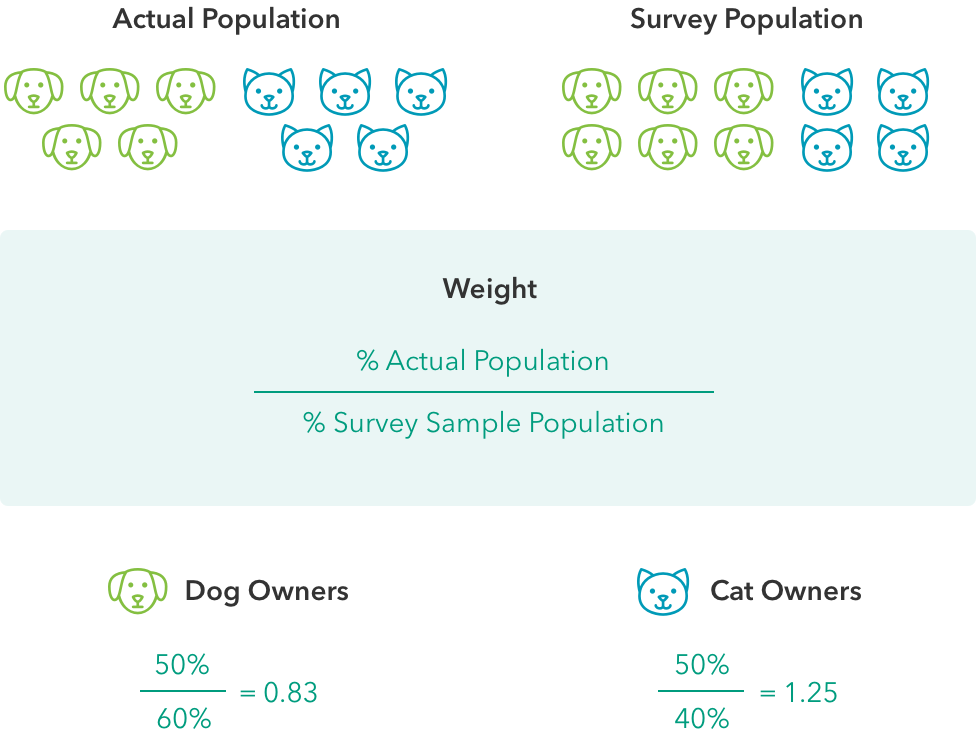
The formula for creating a weight is simple — take the percentage of your population you are trying to re-create and divide it by the percentage population in your survey. For example, imagine we're conducting a survey of pet owners and know half of the actual population owns a dog, while the other half owns a cat. However, only 40% of our survey respondents are cat owners.
In this case, we would assign a weight of 1.25 to the cat owners in our sample, and dog owners would get a weight of 0.83.
How do we know what metrics to use when creating a weight?
Discerning what metrics to use in a weighting scheme is both an art and a science. Each situation is different, and you need to consider factors such as sample availability and the topic of the research.
Consider a company with varying levels of sales reps. We need the voices of not only experienced, high-volume sales reps, but also the people just starting. To balance these with our real population, we assign each weights depending on their internally-determined sales level. Sales level makes sense for weighting these reps, but that strategy might not be right for other industries.
Beware — weighting data isn't always that simple
Multiple metrics
Weighting often involves more than one metric, but we don't always know how metrics intersect. This situation would call for more advanced weighting techniques.
Distorted data
As weights get higher, there is more potential for distorted data, particularly if people with high weights have a low base size in the sample. For example, if only 10% of our survey were cat owners, each cat owner respondent would be counted five times.
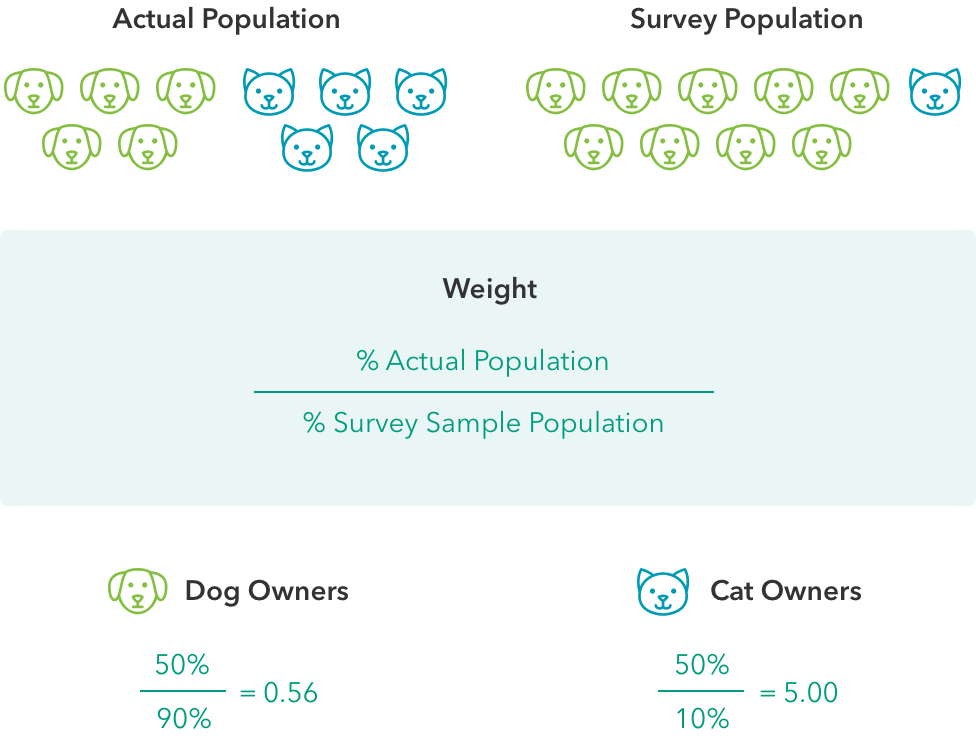
If the small population of cat owners in our survey had different views than most cat owners, weighting them to reflect the actual population of cat owners could lead to misrepresentative data. One way to account for this would be to add quotas before fielding begins to ensure that the weighting variables do not become highly disproportionate.
Think you're ready to play the weighting game?
Although the concept of weighting is simple and straightforward, applying weighting to your data can be complicated and nuanced. Before you field your next survey or plan your next round of research, partner with us to analyze your objectives and needs. The right plan, resources, and experience can make a difference in uncovering actionable — and accurate — insights.
Bellomy is here to help you make informed decisions on how to increase accuracy and representation with weighted data.