How to optimize a product line
When developing a new product line or evaluating whether it might be time to adjust an existing one, you want to get a sense of how well each combination of products might perform in front of consumers and how profitable each could be. But how do you predict measurements as obscure as reach or as uncertain as profitability? How can you know which products actually contribute to the potential success of the product line as a whole?
When it comes to product line optimization, we use the following three approaches: Total Unduplicated Reach and Frequency (TURF), Total Reach and Frequency (TRF), and Shapley Value Analysis (SVA).
Optimizing a single product line
When optimizing a product line, the first thing you’re usually looking for is the “best” (or optimal) combination of products to include in the product line. “Best,” here, is defined by the product or service combination with the greatest reach — in other words, the one estimated to drive the most purchases from consumers.
To determine this, we often use Total Unduplicated Reach and Frequency (TURF) analysis. This tells us what percentage of consumers would be happy with at least one product in a product line offering. However, this only gives us a single, optimal option, while several other product line options could have nearly the same reach.
Comparing near-optimal solutions
“Second best” isn’t always awarded the silver medal when it comes to developing or refining a new product line or bundle. As mentioned, there are often several other options that could easily have almost the same reach as the optimal solution. Imagine that one particular item in the optimal product line is incredibly expensive to produce, but another, less expensive product line has just barely less reach than the optimal — not so less-than-optimal now, right?
We developed Total Reach and Frequency (TRF) analysis to allow us to compare near-optimal solutions — giving you the opportunity to identify the most practical solution, rather than the most ideal. Instead of showing the one optimal product line solution, a TRF analysis produces every possible combination of a certain number of products (all combinations of three products, all combinations of four products, etc.) to see which ones are closest to the optimal mix. It also provides the average number of products that reach consumers within each combination, or the frequency:
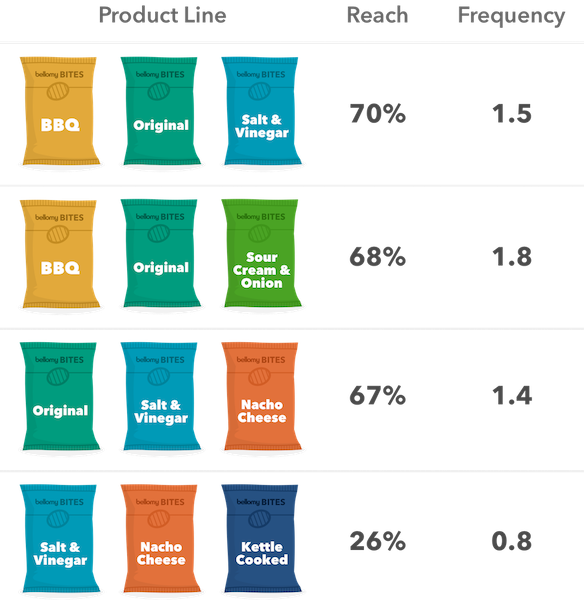
Having both the reach and frequency of various product line or bundle options provides additional insight that can help determine when and where you might want to trade off consumer reach with the cost of establishing the line or bundle. However, TRF analysis data can not be tied or attributed to individual items within each combination. It complements TURF by providing “next-best” options in terms of reach and assessing the average reach of specific combinations.
Identifying item-by-item reach
When looking to find the impact each item brings to a product line or service bundle, we use Shapley Value Analysis (SVA). This approach runs every possible combination of the items to see how much each one individually contributes to overall reach. An individual item’s contribution to reach is found by noting the difference in reach when that item is included in the product line vs. when it is not included:
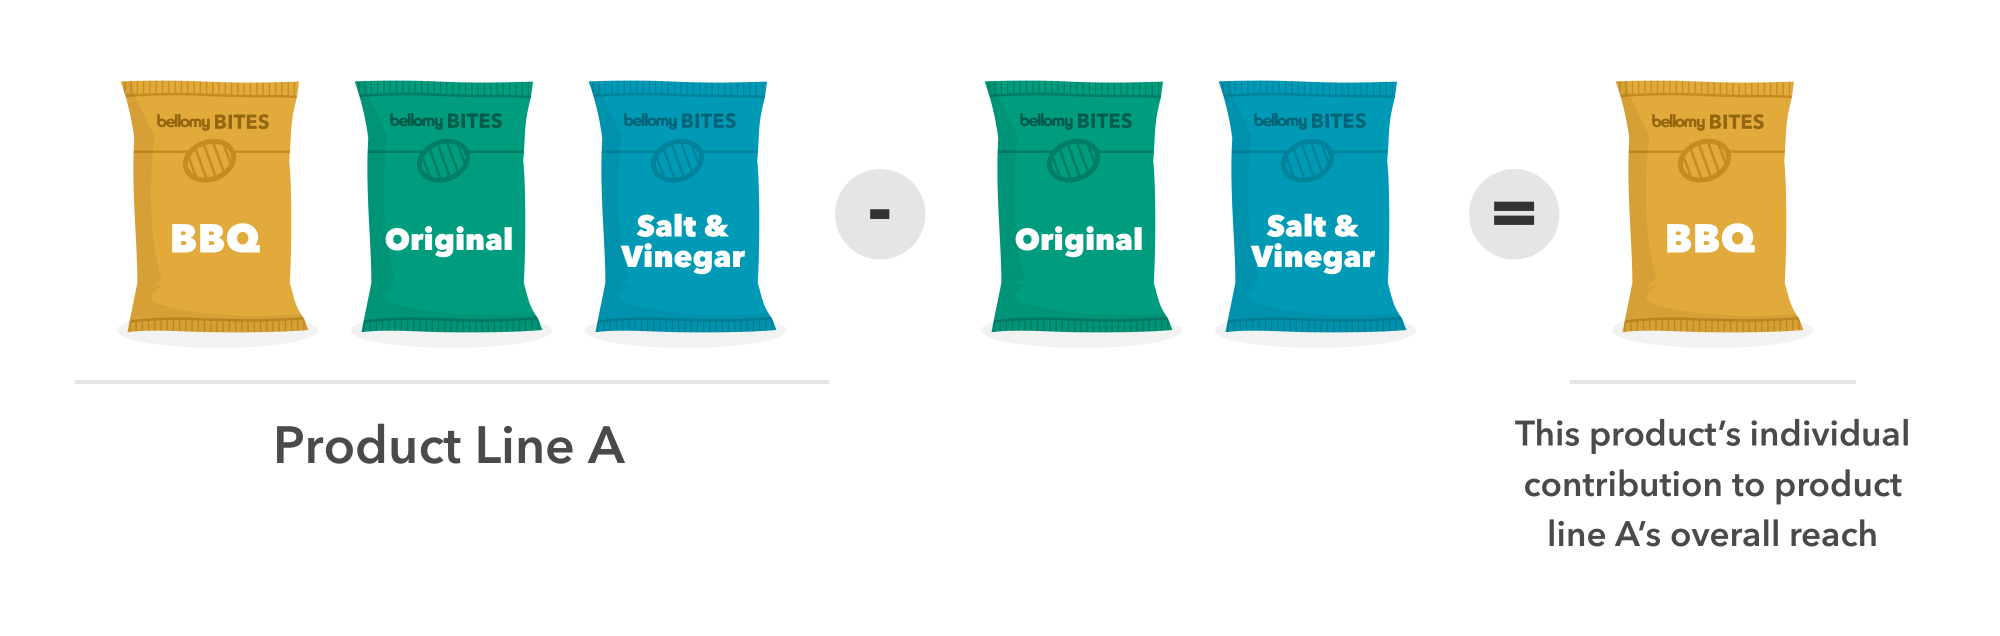
While this approach does not give a definitive answer to an optimal product line, it tells you how each item will impact the overall reach of the product lines or service bundles under consideration. This can provide strong directional insight as you compare items and determine which ones may be worth keeping versus which ones you might want to remove. SVA can significantly impact your decision making by providing the tools to get you closer to that optimal product line.
Maximizing product line potential
Product line optimization is most effective when these approaches are used in conjunction with each other. TURF analysis provides the optimal solution, TRF analysis indicates options that are almost as effective as the optimal (but could be more cost-efficient), and SVA provides insight into which individual items are truly moving the needle with customers.
Looking to optimize a new or existing product line? Get in touch with one of our Advanced Analytics professionals for guidance on what kind of insights and analysis you might want to consider before going to market.